Google Analytics eCommerce Dashboard – how well do you know how to use it?
With the help of Google Analytics, we can better identify business growth opportunities while also targeting potential customers more effectively. Data analysis and identifying growth opportunities are fundamental elements of successful marketing campaigns, so let’s explore how to collect essential data using Google Analytics.
Google Analytics is an extremely complex tool that requires significant time to fully understand and use to its potential. Many users do not utilize all the information the platform provides, or they may not even be aware of its existence. However, there is one feature that can make things easier to manage and understand: Dashboards.
What is a Dashboard and How Can It Help You?
Dashboards are sets of widgets that provide an overview of the most important reports and metrics for a business. Their purpose is to monitor multiple values or discover correlations between different reports over a short period, saving both time and money.
The best part is that you can adjust the time range, and all your reports will update based on the parameters you’ve selected. You can also filter and analyze dashboard data using the segments you previously created in Analytics.
Types of Widgets Available in Dashboards
You can choose from six types of widgets to display data. Additionally, you can convert a pie chart into a donut chart or switch a bar chart from vertical to horizontal. These visualizations also have some limitations. For example, a timeline chart cannot display total visits, and bar charts, although great for comparisons, do not show percentages of the total. Nevertheless, dashboards simplify your work significantly by allowing you to track all your data in one place.
How to Create a Dashboard
As mentioned, widgets help you create your own dashboard, but the process can be time-consuming. To simplify, you can simply click “Create” and choose from hundreds of dashboards in the library. These can be customized to show only the data and reports you need. To make the process even easier, Pixelflow Agency LLC has customized a dashboard – the Standard E-Commerce Dashboard – which we use for all clients with an online store and an active e-commerce module.
How Does a Standard E-Commerce Dashboard Help?
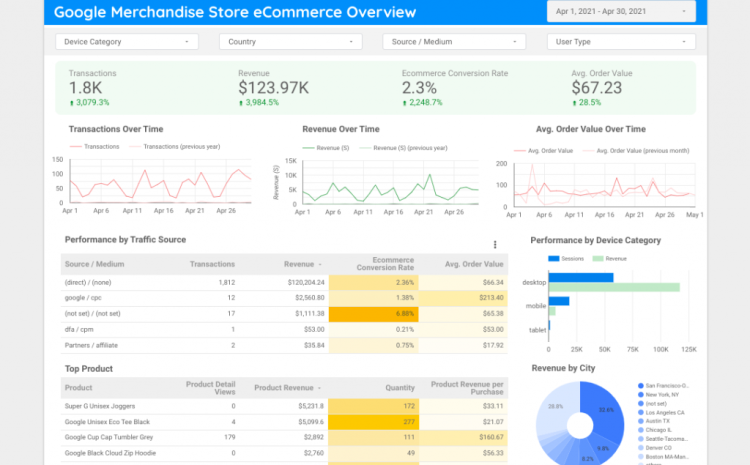
The Standard E-Commerce Dashboard gives an overview of online store sales. All you need to do is select the time period you want to analyze to see revenue or conversion rates, the source generating most of the revenue, the devices used, and the hours with the highest activity.
How to Correctly Interpret the Data
Gross Revenue – Every business should have a business plan with projected revenue for the upcoming period. This metric shows where we stand relative to the plan.
Transactions – If there is a drastic change in this metric, the next step is to analyze the Acquisition report to identify the source(s) causing this increase or decrease.
AOV (Average Order Value) – The average value of purchases during a sale. It’s important to set a minimum threshold for this metric to maintain profitability.
e-Commerce Conversion Rate – One of the most important metrics for an online store. A drop in this rate can result from multiple factors: irrelevant traffic from paid campaigns, higher prices compared to competitors, or poor user experience on the site (a crucial aspect).
Revenue by Source/Medium – What percentage of revenue does each channel bring, and how useful is this information? The first conclusion is to allocate more resources to channels generating the highest revenue. However, also check the report Conversions → Ecommerce → Multi-Channel Funnels → Path Length to understand how other channels influence purchasing decisions before reducing budgets on other channels.
Unique Visitors and Revenue – Ideally, this chart continues to grow. When it does, it indicates that your efforts are going according to plan. If it starts to decline, a thorough analysis is needed to determine the causes.
Best Hours for Sales (24-hr) – Knowing and applying this information can increase the profitability of your online marketing campaigns. You should increase budgets and bids during the hours that convert best.
Top 10 Best-Selling Products – Insights into top-selling products are essential for the management team. This ensures that store owners and marketing teams maintain well-stocked inventory and increase promotion for high-demand items.
Transaction and e-Commerce Conversion Rates by Device Category – Beyond marketing decisions based on various data points, this report is used for website optimization. If most transactions are on mobile devices, the platform must be mobile-friendly, with the simplest steps to complete a purchase.

Write a Comment